Climate Change Damages - Rising Seas, Storms, and Flooding
Buy the book
In this post from NET-ZERO:
Why does Global Warming cause the Sea Level to rise? Expanding waters and melting ice sheets - what climate models tell us about future change.
How might rising sea levels impact global migration? The countries and cities around the World most at risk from rising waters.
Why are hurricanes, cyclones, storms, and floods increasing due to climate change? How a warmer atmosphere holds more water and creates more frequent and/or more intense extreme wet weather.
Peak Population, Peak Consumption, No System Change
If we move towards a peak consumption world where we continue to power the economy with fossil fuels, climate models forecast over 3⁰C higher temperatures by the end of this century, with a risk to further increases.
A 3⁰C average temperature increase may not sound huge but remember averages don’t tell the full story. Average land-ocean surface temperatures may increase 3⁰C, but big cities and the Arctic will warm over 2-3 times as fast, mid-latitudes 2 times faster, and land 1.5 times faster, with all of these increases balanced by an ocean which warms at two thirds of the average rate.
The extra trapped heat means nights will warm more than days, winter more than summer, and the chance of extreme hot weather will rise exponentially as the chance of extreme cold weather fades.
How will these climate changes impact the weather we experience every day? This post will take a look at the potential climate change induced damage from rising seas, storms, and flooding…
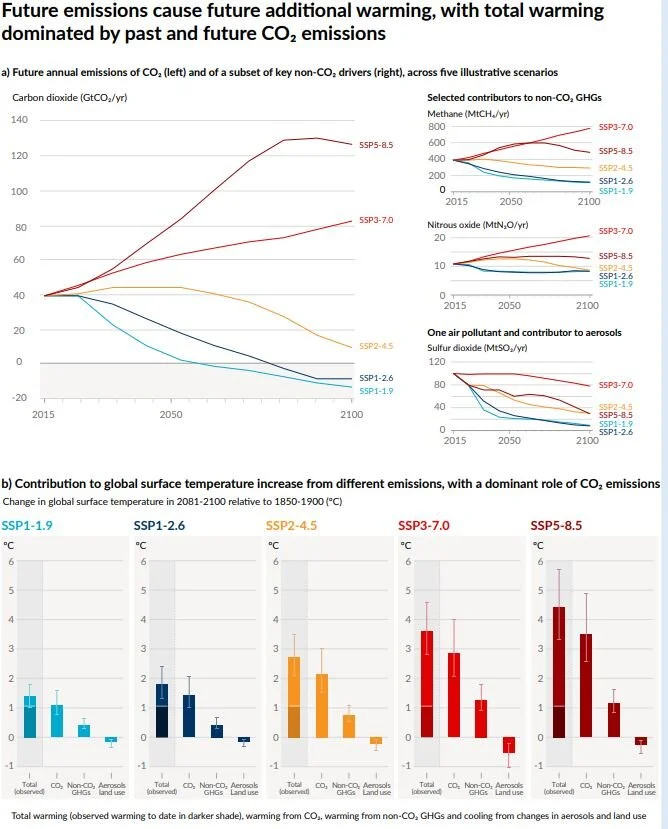
Shows the International Panel on Climate Change scenarios - SSP3-7 represents a pathway where little change is made to energy and agricultural systems and SSP5-8.5 is a scenario (now unlikely) of a return to increasing consumption of coal and coal products. Both mean more than 3C warming this century. From the latest IPCC report AR6 WG1 SPM.
Sea Level Rise
The combination of melting ice sheets and warmer water results in a rising Mean Sea Level (MSL). The oceans are already 0.2 metres higher than 100 years ago driven by melting ice (0.14 m) and warmer expanding water (0.06 m). Every degree of warming is estimated to increase the sea level by 2.3 metres over 2,000 years.
Every 360 billion tonnes of ice melting from land will raise sea levels by 1 mm. Since 1970 glaciers have lost 5,000 billion tonnes of ice, Greenland 2,500 billion tonnes and Antarctica 2,000 billion tonnes of ice.
By the end of this century more than half of all glaciers will have disappeared and the great ice sheets could be irreversibly melting for centuries to come. The IPCC estimates between 0.4-0.9 metres of sea level rise this century under a peak emissions scenario. But scientists continue to find evidence that ice is melting faster than anticipated and estimates may need to be revised even higher.
The last time Earth had CO2 concentrations at current levels was 2-4 million years ago; temperatures were 4⁰C hotter and sea levels were 25m higher with little Arctic ice and no West Antarctic Ice Sheet. The faster temperatures rise, the greater the risk of reaching dangerous tipping points which can accelerate melting. One of the most significant of these would be if large areas of the West Antarctic Ice Sheet broke off, sliding into the ocean as warmer waters melt it from below.
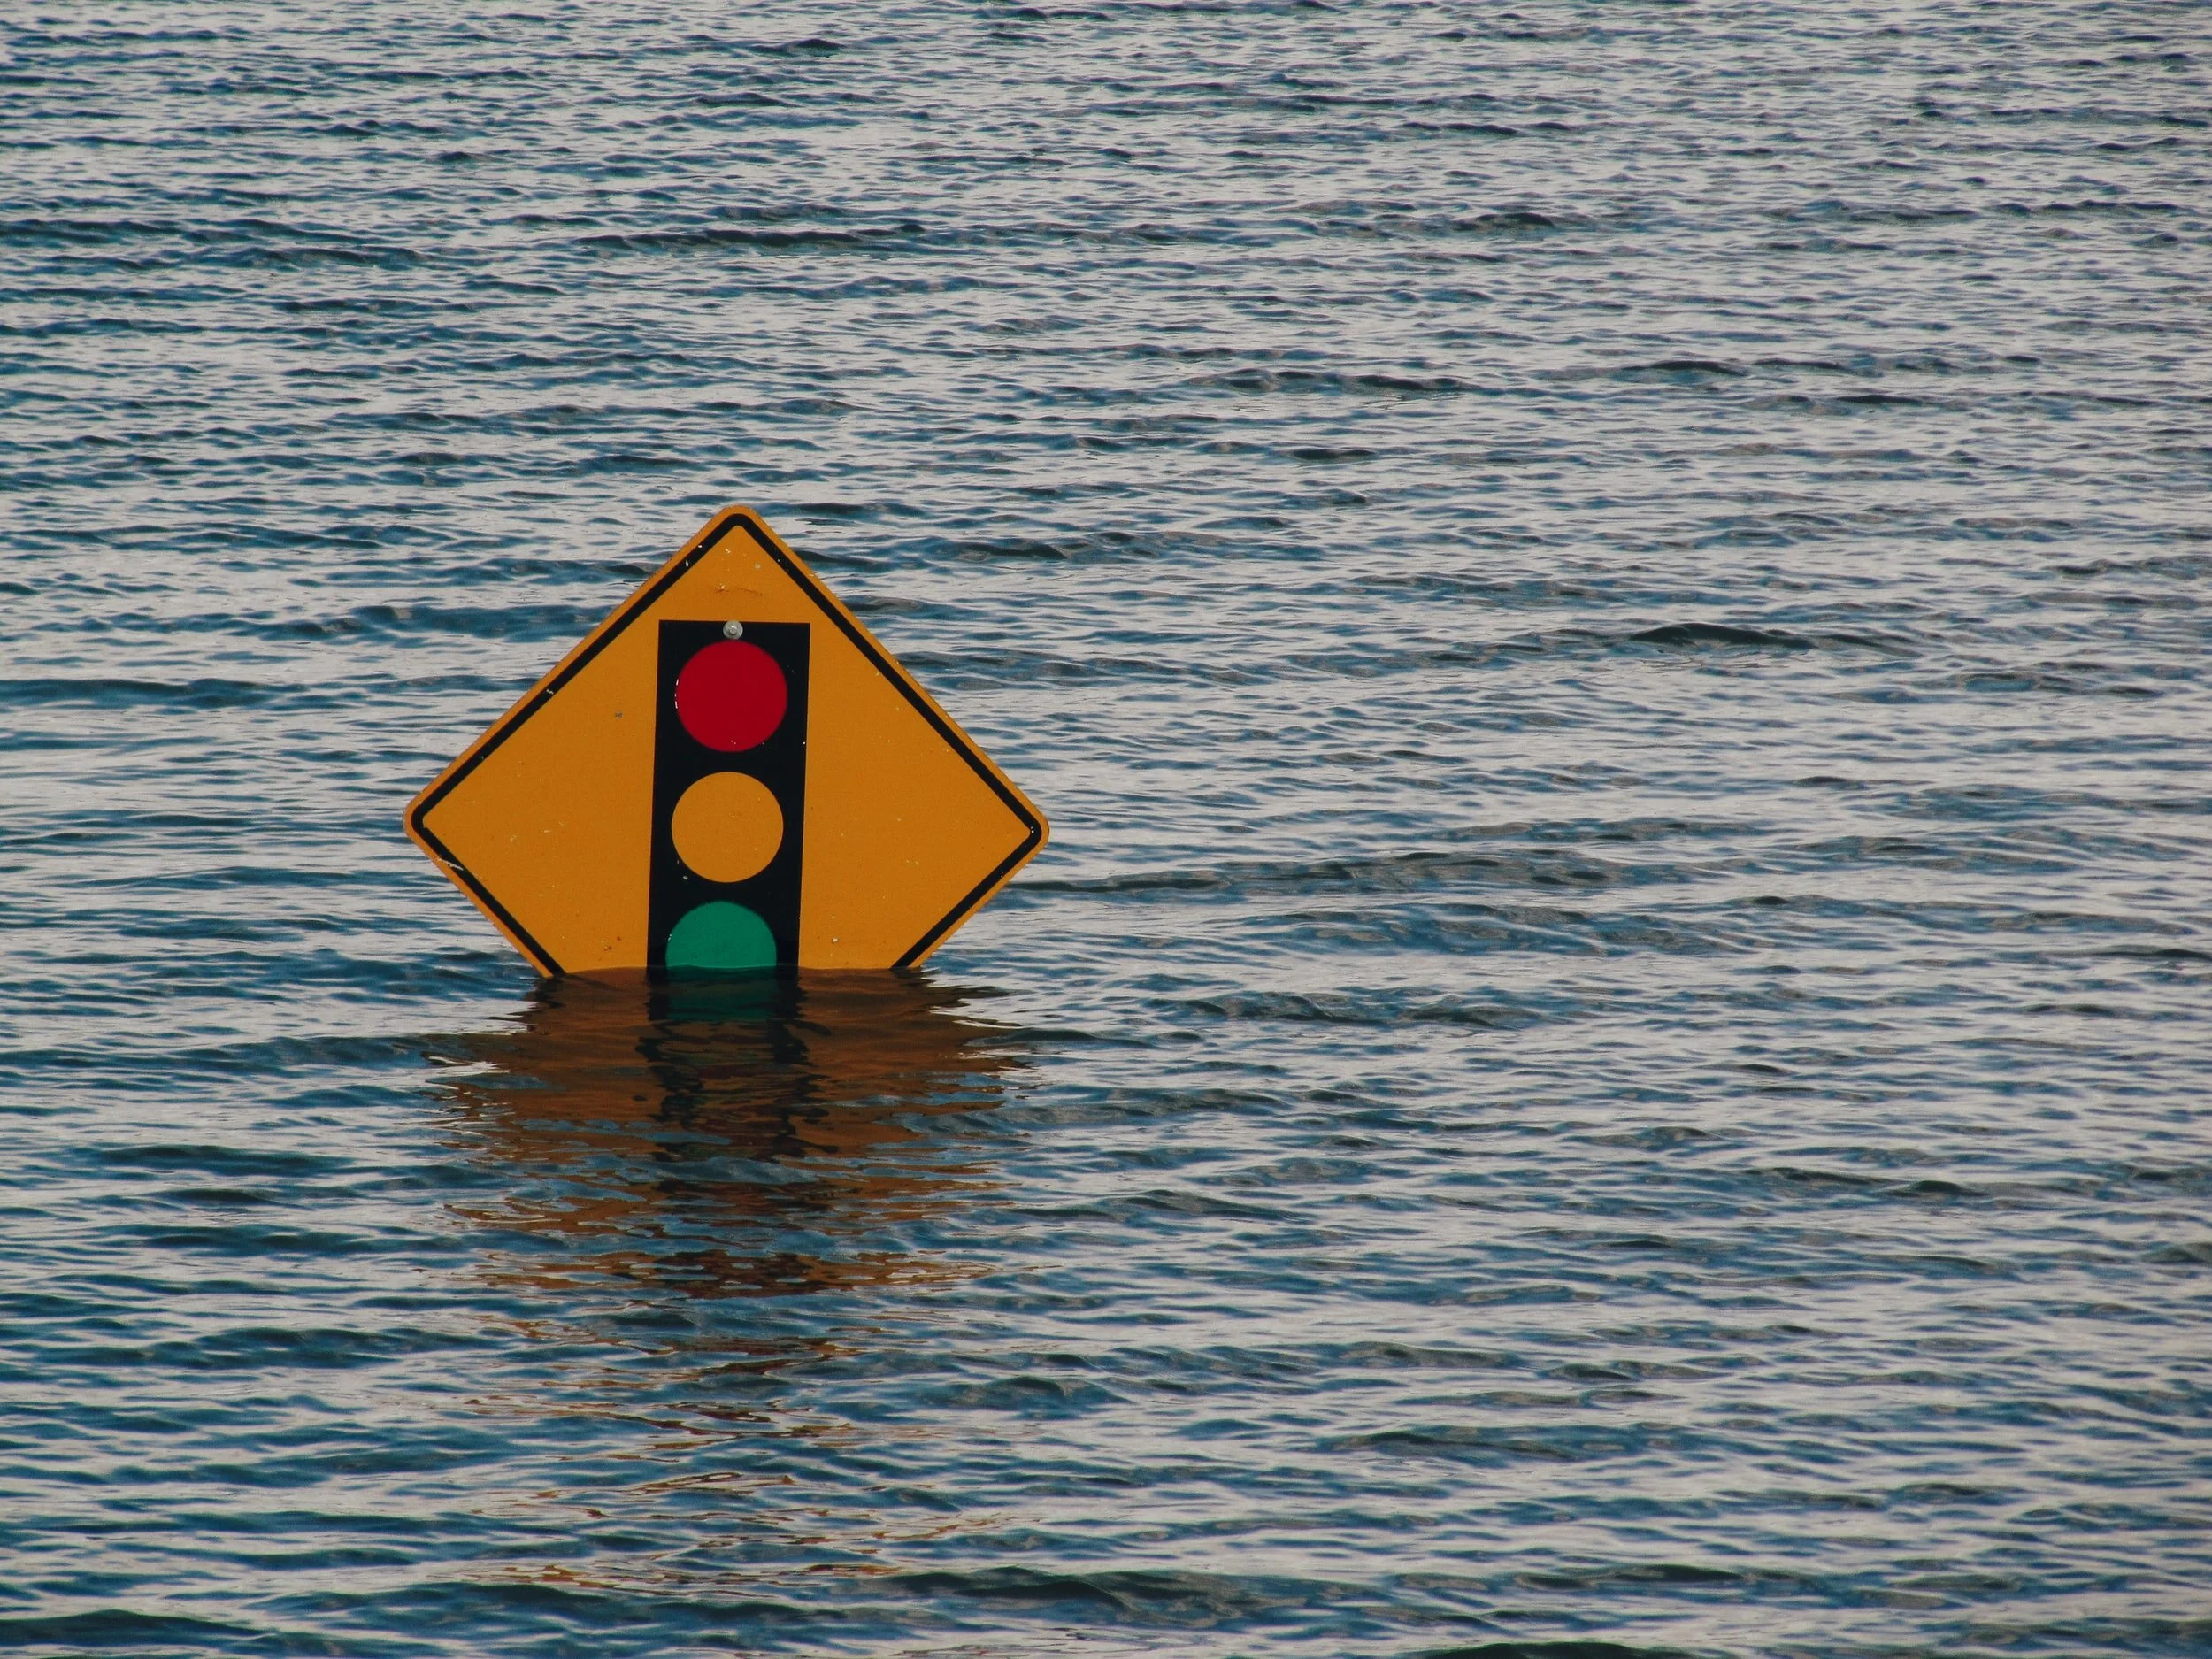
Unsplash by Kelly Sikkema
The Human Impact of Rising Waters
Globally, 382 million people live in areas which are less than five metres below sea level. The Maldives, Bahamas, Bahrain, and Suriname have 80-100% of their combined 1.4 million population in low lying coastal regions. China, India, Bangladesh, and Indonesia have a combined 300 million people in low lying areas (~20% of their population).
Based on this data, and assuming little adaptation, by the end of the century up to 90 million people might have been displaced (1% of the global population) by rising seas.
Our estimates compares to the Internal Displacement Monitoring Centre estimate that 50 million could be displaced by the year 2100. The last IPCC assessment puts the number between 72 and 187 million displaced due to submergence and flooding by 2100 if no action is taken
Beyond the year 2100, unless CO2 and temperatures are reduced, sea level will continue to rise over centuries to more than ten metres higher as waters expand and the Greenland Ice Sheet disappears, drowning Miami, Manhattan, London, Shanghai, Bangkok, and Mumbai, and displacing one in ten people across the world.
Elevation above sea level in metres: Miami (2 m), Manhattan (5 m), London (11 m), Shanghai (4 m), Bangkok (1.5 m), and Mumbai (14 m).
Burn the remainder of all fossil fuel resources on the planet and we set a course for >10⁰C higher temperatures and tens of metres of sea level rise over the coming centuries. Half of the global population would eventually need to move.
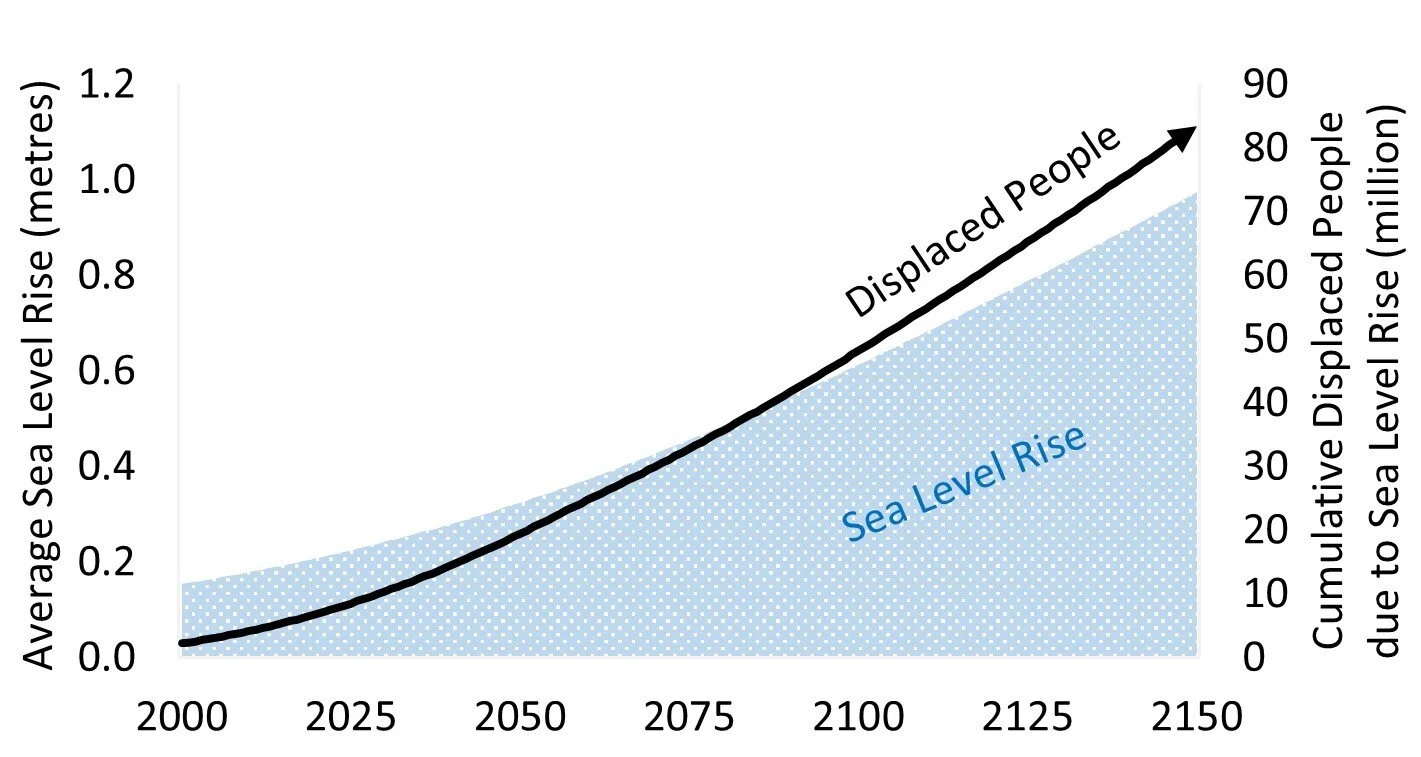
Black Line: Total cumulative number of people displaced due to rising sea levels based on peak consumption, inaction scenario (>3⁰C warming by 2100, >4⁰C by 2150), calculated based on population living below mean sea level as water rises. Shaded Area: Increase in mean sea level in metres projected by our model (in line with IPCC).
Storms and Flooding
Every 1⁰C temperature increase adds 7% more water vapour into the atmosphere, increases precipitation by 2% and extreme rain by 4.5%. It also warms the surface waters of the ocean. When ocean waters reach above 26⁰C (down to 100m) this creates optimal conditions for hurricanes, cyclones, and typhoons to form and helps them travel further, potentially onto land.
Higher energy also means higher wind speeds and the destructive power of storms are proportional to the wind speed to the power of 2 or 3. The damages are further amplified by rising sea levels increasing the risk of storm surge flooding.
Category 5 hurricanes now account for 35% of all hurricanes, this was just 25% thirty years ago. Data from re-insurance company Munich Re shows the annual number of global storms and floods has steadily increased from an average of 220 in the early 1980s to 650 per year. Some of this change can be attributed to greater coastal populations and wealth, but the data and most research agrees that global warming is already impacting the intensity of this class of natural disaster.
The latest IPCC report (AR6) states flooding has already ramped up and it is likely intense tropical cyclone activity (category 3-5) has increased (with western North Pacific storms reaching peak intensity further north). With rising temperatures, the frequency of tropical cyclones may flatten or even decline, but most research suggests the intensity of storms will increase. Every degree of warming is expected to add 3-5% wind speeds or up to 16% to the destructive power.
More intense tropical storms will continue to batter the Gulf of Mexico, south and east coast US, Central America, India, Bangladesh and South East Asia. The reach of tropical cyclones may extend further as warmer waters expand Poleward.
More water vapour in the atmosphere also means mid-high latitude regions of the northern hemisphere are already experiencing 5% more rain and snow. This will continue to rise at a rate of 5-10% per 1⁰C warming and continue to increase the risk of flooding across South East Asia, Tropical Africa, Northern South America, North East Brazil, South Africa, the UK, and many other parts of the planet.
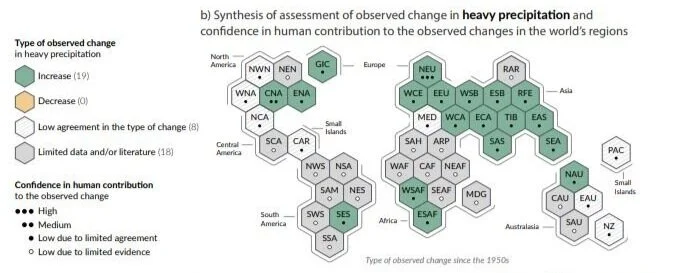
Shows the change to extreme precipitation events since the 1950’s across all areas of the World. From the latest IPCC report AR6 WG1 SPM.
We need to change global energy and agricultural systems and reach Net-Zero over the coming decades if we are to avoid the worst impacts of climate change.