How much will zero carbon energy cost?

In this post from the book NET-ZERO:
What is the Levelised Cost of Energy (LCOE)? How we can compare the cost of energy from different sources with different upfront investment, running costs, and useful lives - comparing apples to apples.
Why are learning curves important? The rate at which the cost of modular technologies decline with scale (not time). Net-Zero is about technology not geology.
Which energy sources will be cheapest in the future? Why learning curves point to wind and solar as the cheapest form of electricity generation (and close to coal and gas direct heating) once scaled.
Levelised Cost of Energy (LCOE): Different Technologies on a Like for Like Basis
The levelised cost of energy represents the total cost of an energy installation in today’s money (net present value) divided by the total useful energy it provides through its life.
There are three main parts to calculating the cost of an energy installation: capital costs, operating costs, and fuel cost. Capital cost is the one-off total cost of building and financing the facility. Operating costs are the ongoing cost of maintenance, labour, insurance, and overheads paid, regardless of how often the plant is run. Fuel is the cost of the energy source and the amount required depends on the output of the plant.
Levelised Cost of Energy calculations are used to compare the cost of different technologies. For example, a coal electricity plant is five times cheaper to build than a nuclear plant but will last only half as long – LCOE can tell us which is cheaper. Solar or wind farms cost twice as much as natural gas power plants upfront but have no ongoing fuel costs because the wind and sun are free. LCOE lets us compare these different technologies on a like for like basis and represents the wholesale cost of generation which utilities companies charge us in our energy bills.
Experience Curves: Estimating the Future Price of Energy based on Scale not Time
The term experience curve was coined by the management consultant BCG in 1966 while they were performing a cost analysis for a major semiconductor manufacturer. The theory held that every time the accumulated volume of computer chips doubled, the company’s unit production cost would decline by 20-30% because of the accumulated “experience” of manufacture. It turned out that not only did the experience curve work for the semiconductor industry, but the concept could also be applied nearly anywhere.

Computer Chip. Unsplash
For most industries, the cost of production declines as the scale of production increases, mostly thanks to improved manufacturing technologies, the division and specialisation of labour, and the lower allocation of overhead costs per unit production. A larger industry also attracts more competitors vying for a greater share of the market which pushes companies either to improve products or lower prices and recoup the difference through better production techniques or accepting lower profit margins.
The idea of an experience curve can be applied to most manufactured products but the rate at which the price drops will vary. Generally, cost of production will fall faster for highly standardised, repeatable, modular products. It will fall slower where there is a greater degree of variability, customisation, or batch processing in the design. The price will follow the cost of production unless supply and demand imbalances or consumer choice or marketing ploys intervene.
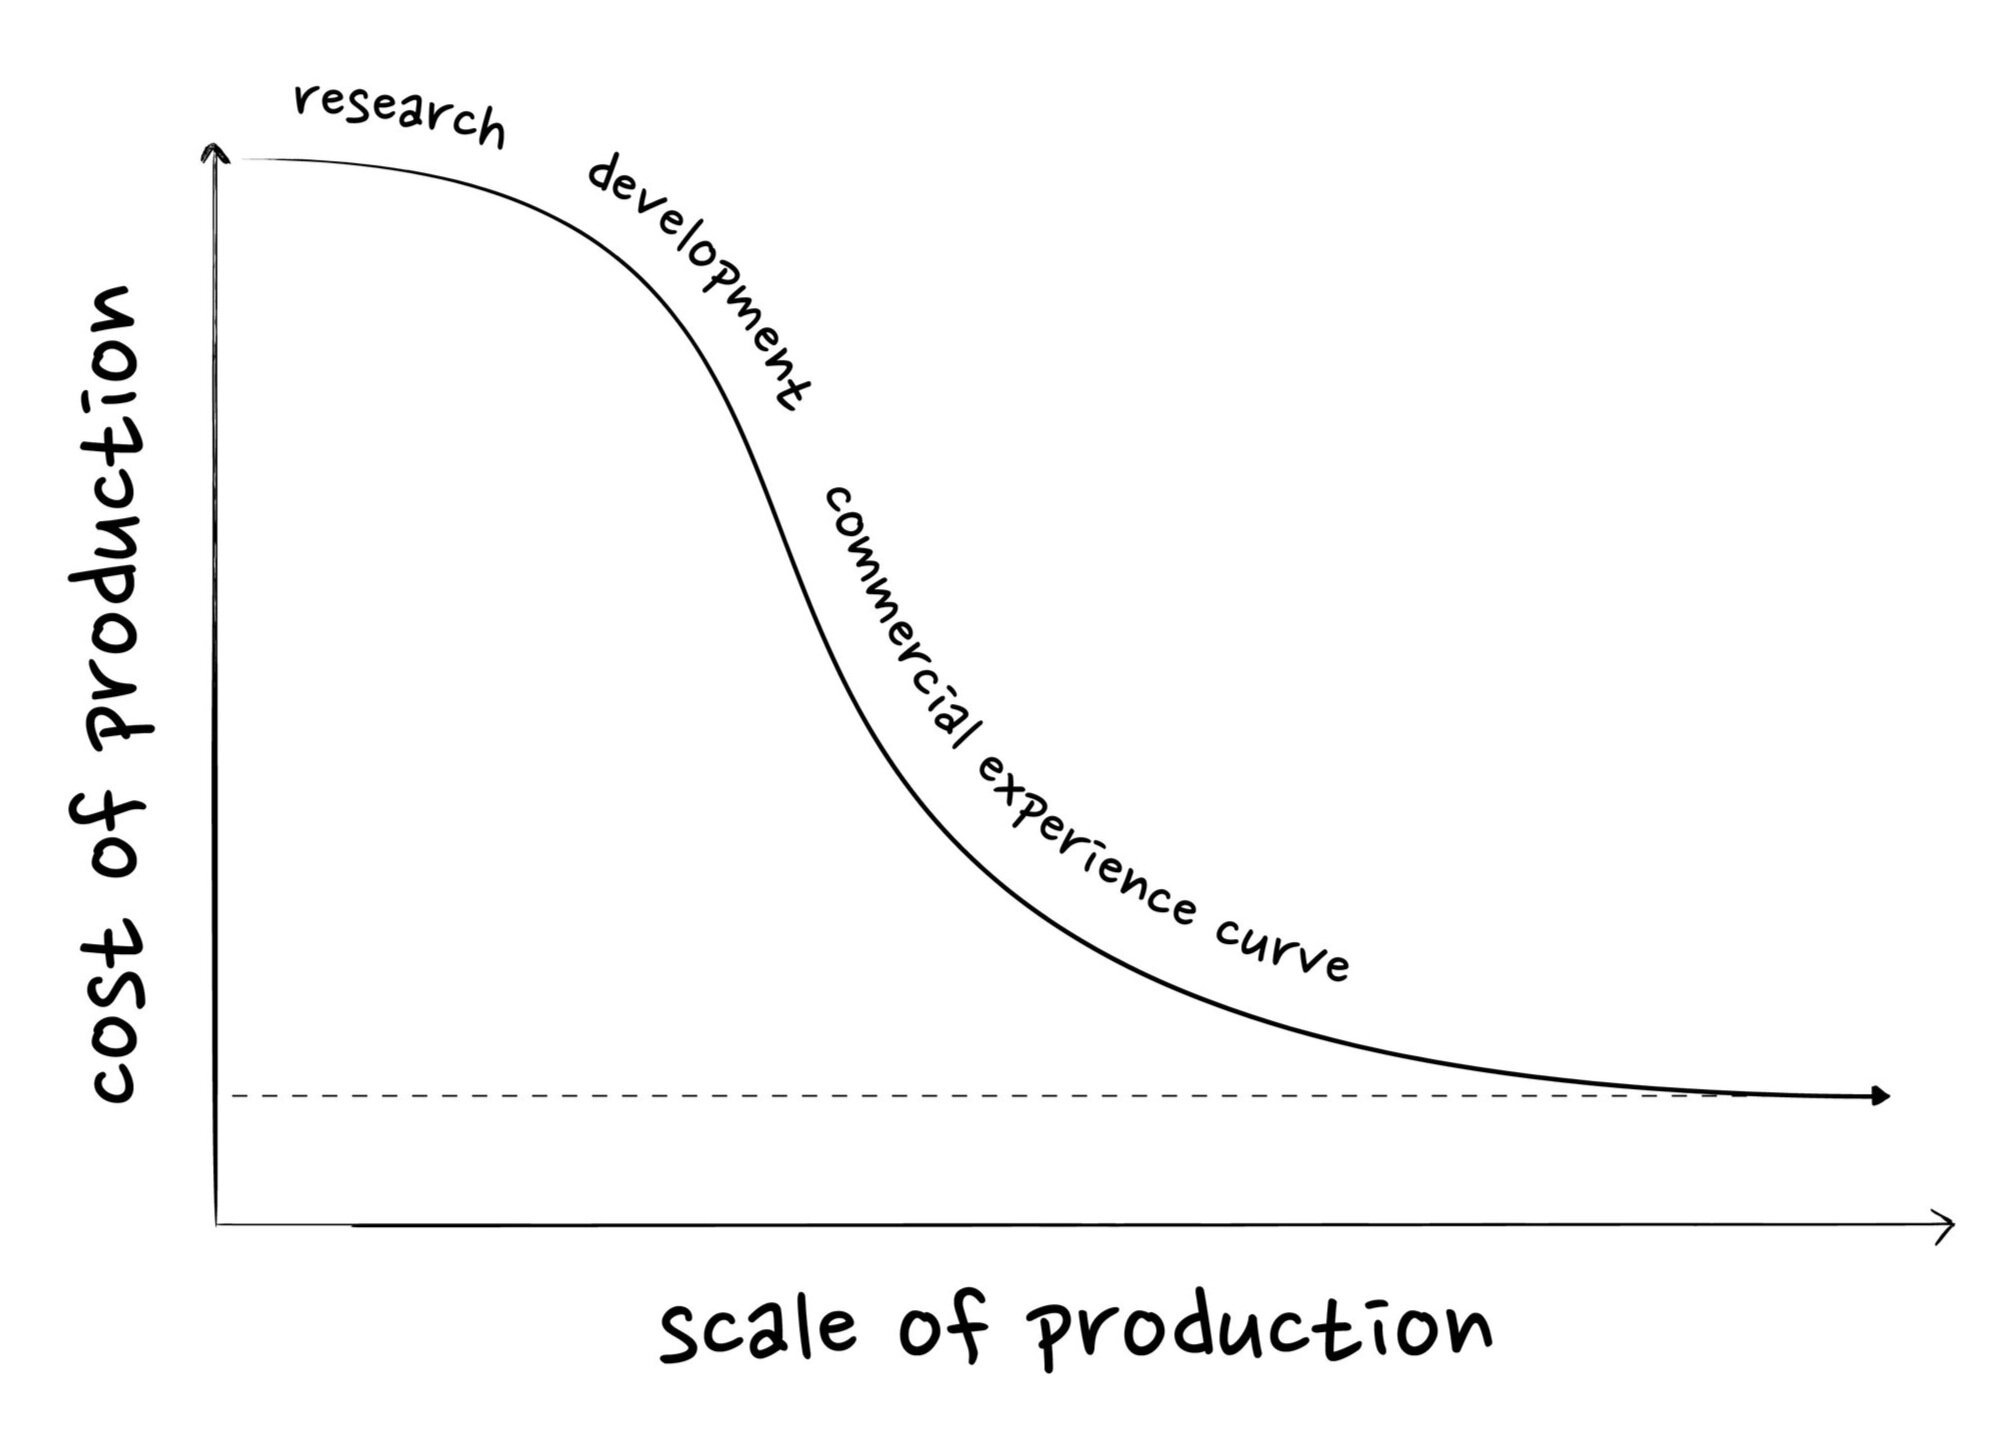
Prices decline exponentially, with the greatest falls up front and then price reductions getting smaller and smaller as they trend towards a floor price. This represents the rock bottom cost of extracting and processing the materials with efficiencies near physical limits.
We will use the idea of experience curves to explore the price of energy technologies at greater scales of production. The idea that prices decline with accumulated experience and not just the passing of time is key to understanding the economics of a net-zero transition.
Energy Supply: Levelised Cost of Energy (LCOE) Today
Burning coal, gas, or wood for heat costs less than $2 cents per kWh and will likely remain the cheapest source of low-grade energy given the high efficiency and low equipment costs. Delivering higher quality energy in the form of electricity or liquid fuel comes at a higher price.
The incumbent technologies for electricity generation are centralised thermal power plants run on coal, gas, or nuclear fuel and deliver wholesale electricity between $2.5c and $8c per kWh with little room for improvement. But over the last 20 years, the cost of wind and solar electricity generation has dropped by over 90% and now competes with the cheapest fossil fuel electricity in most regions. Wind and solar account for just 2% of final energy, so if we scaled up generation towards two thirds of global supply, installations would be required to double a further 4-5 times. With solar costs falling by 20%, and wind by 10%, every time installations double this implies renewable electricity could be delivered at less than $2-3c per kWh in all regions. Wind and solar wholesale electricity would become cheaper than fossil fuel electricity and close to competing with coal or gas heating. Some solar contracts in sunny areas are already being struck at these prices.
Oil is the premium energy source for transport, packing more energy into a smaller volume to power cars, ships, and planes over greater distances on a single refill. At around $5c per kWh energy, you pay for the privilege. Third Generation (3G) biofuel from algae oil costs double that of crude oil today, but once optimised could reach a similar price point.
LCOE At Scale
I have been careful not to use the term “future costs” but rather “at scale” cost because it’s not the passing of time that brings down the price for commercialised technologies, but the amount of installed capacity and the experience curve.
Fossil fuels technologies are already fully scaled, near efficiency limits, and deep on the experience curve. Coal and oil should expect minimal further cost reductions, but prices will remain volatile depending on market supply and demand. Natural gas may trend towards the lower end of its cost range with increased global trade of liquefied gas and adoption of higher efficiency combined cycle designs.
Future designs of nuclear are looking to improve safety, waste, and sustainability of uranium resources; however, capital costs will likely remain high. Smaller Modular Reactors (SMR) built in factories and unloaded on-site are looking to reduce costs but remain unproven.
Significant cost improvements can still be made in solar, wind, and 3G biofuels as manufacturing costs decline, power output scales, and efficiencies improve.
Scaling Solar PV Electricity
Since the year 2000, installed solar capacity has increased from 500 MW (500,000 kW or equivalent to one coal power plant) to over 700,000 MW today (1,400 coal plants). Every time the installed capacity of solar has doubled, the installation cost has declined by 20%. Solar PV installation costs have dropped from $12 million to less than $1 million per MW over the last 20 years. The price of solar energy per kWh has fallen even faster with 30-40% reductions every time installations have doubled, because not only has the build cost come down but the financing has grown steadily cheaper.

Solar PV experience curve shows the decline in the average cost of installing 1 MW of solar farm capacity, as installed capacity has increased. Each time capacity has doubled, costs have dropped 20%.
The average cost of capital for a solar installation in Germany was 8% in the year 2000 – banks wanted a 6% return per year on their loans, partners wanted over 10% on their equity stake. Today, cost of capital has dropped to less than 2.5% (5% equity, 1-2% debt) because solar projects have proven low risk and reliable and interest rates have fallen across the world. This represents a best-in-class financing system with a competitive and well-regulated banking industry and certainty on revenue streams. The average cost of capital across the world is closer to 7% (~5% excluding inflation) but continues to trend down as developers become more confident with the performance of the technology and financing structures evolve. Every 1% reduction in the cost of capital or discount rate reduces the cost of renewable power by 10-15%.
Solar PV still represents less than 1% of final energy consumption leaving plenty of room for further cost declines as it scales up. If Solar PV were to grow to one third of final energy, installations need to double a further five times. Following the same (20%) experience curve implies costs drop towards $0.25 million per MW or less than $2c per kWh without violating the floor price of production. Projects are already being bid at less than $2.5c per kWh for large solar farms in the Middle East where peak sun hours are very high.
Scaling Wind Electricity
Wind makes up just over 1% of final energy supply so the production and installation of turbines has not reached full scale economics. The experience curve has delivered a 10% cost reduction for every doubling of capacity. Slower than solar, because the installations are less modular, but still rapid. If wind were to scale to one third of total final energy needs, cumulative capacity will double another four times over. Build costs could decline from $1-3 million to $0.7-2 million per MW and bring the total cost of wind electricity to between $2-4c per kWh.

Wind experience curve shows the decline in the average cost of installing 1 MW of wind farm power capacity, as installed capacity has increased. Each time cumulative capacity has doubled, costs have dropped 10%.
Third generation algae oil is more than double the price of oil products today, but the process is yet to be optimised. Take growth rates and yields to best-in-class levels and costs have the potential to more than halve.
Scaling Net-Zero
Levelised cost analysis (and the price at which new contracts are being bid) shows that renewable electricity from wind and solar is already competing with fossil fuel electricity all over the world today. But as the installed capacity of wind and solar scales up from just 2% of final energy today to become the backbone of future energy supply, installations will need to double another 4 or 5 times over. The learning curve tells us that this will drive down the cost of wind and solar electricity towards $2-4c/kWh and will make renewables one of the cheapest sources of energy in the future. There is no reason to sit on our hands and wait, the faster we scale up the production and installation of a net-zero future, the cheaper that future becomes - its all about scale not time!

Levelised Cost of Energy supply today and at full scale excluding inflation. Combined capital costs, operating costs, and fuel costs per kWh of useable energy product – electrical or thermal. Represents the wholesale cost of generating energy before distribution, overheads, and taxes. We use a standard 3% discount rate / post tax weighted average cost of capital excluding inflation (equivalent to ~5% nominal post tax, and 6.5% nominal pre-tax) for all technologies both today and at full scale – this is the same as our damage discounting and also represents the mid-point of global renewables financing today (7% nominal post tax) and best in class financing today (2.5% nominal post tax). Author’s standardised LCOE calculations, using data sources.
Extra Info on the Levelised Cost of Energy Today
A 500 MW coal fired power plant can cost anywhere from $1 to $4 billion to build and is designed to run at an average load factor of 80% for 30 years. This brings levelised capital costs (including financing at 3%) to between $1c and $4c per kWh. Add another $1c for running costs and $1-3c for coal and the total levelised cost comes to $3-8c per kWh of electricity. A similar 500 MW Natural Gas facility is far cheaper to build at less than $1 billion dollars, but gas is slightly more expensive. The total levelised cost is around $2.5-6c per kWh.
Nuclear facilities tend to be at least double the capacity of coal or gas, at 1,000 MW, and will cost anywhere from $5 to $20 billion to build and eventually decommission. The facilities are designed to run at 90% and to last for over 60 years. The levelised capital cost including financing is between $2.5-7.5c per kWh plus another $1c to run and $0.5c for fuel. Total LCOE of $4-8c per kWh electricity which includes the cost of decommissioning. Arguably the economic costs of major disasters such as Fukishima and Chernobyl could be added to the estimated future price of nuclear energy, these disasters cost around $500 billion which over the 90,000 TWh of nuclear electricity generated throughout history adds an extra $0.5c per kWh.
Solar PV has reached a price point where it is competing with fossil fuel electricity. A 1 MW installation costs around $1 million and will last 30 years or more. The average output depends on the location, closer to the equator and the panels receive more sun all year round. With over 90% of people on Earth living between 20 and 40 degrees north, the average load factor will be between 15-25% of rated power. This brings capital costs to just $2-2.5c per kWh plus another $1-2c for maintenance. A total LCOE of $3-4.5c per kWh.
Wind power has also achieved significant price declines. A one MW wind installation costs $1.5-3 million to build but will run at 30-45% of rated power on average (onshore and offshore respectively): total capital costs of $2-4c per kWh plus maintenance brings wind electricity to $3-6c per kWh.
Oil and derived products such as gasoline, diesel and jet fuel, cost anywhere from $2c to $7c per kWh depending on the price of oil ($25-120 per barrel); first generation corn ethanol is a similar price. But run these fuels through a combustion engine and only one quarter of the energy is turned into motion of the vehicle.
Bio algae oil is the most promising biofuel. A 20 million square metre facility could produce 0.5 million MWh of algae oil per year (57 MW power) at a cost of $400 million to build. That’s $3-4c per kWh capital costs, another $3-4c per kWh for fertiliser and $3-4c per kWh running costs brings 3G oil to double the cost of gasoline today.