Inequality and Climate Justice
In this post from the book NET-ZERO:
Why are the impacts of climate change unequal? Many of the poorest countries in the world will be hit hardest by the physical effects of climate change, yet have little capacity to adapt.
What is the relationship between carbon emissions, incomes, and wealth ? The richest countries with 10% of the global population emit 30% of global CO2, take home 50% of global income, and hold 80% of the world’s accumulated wealth.
What is climate justice? How to balance the responsibility for past, present, and future emissions whilst driving a rapid transition to net-zero.
Inequity of Wealth, Damages, and Emissions
The ability to adapt to a changing climate, and deal with the impacts of warming, are highly dependent on wealth. Building sea walls, air conditioning, irrigation, and other adaptations comes at a cost. And wealth is not equally divided. For example, flood defences for sea level rise this century may cost developed countries just 0.1% of GDP but will cost developing countries 1%.

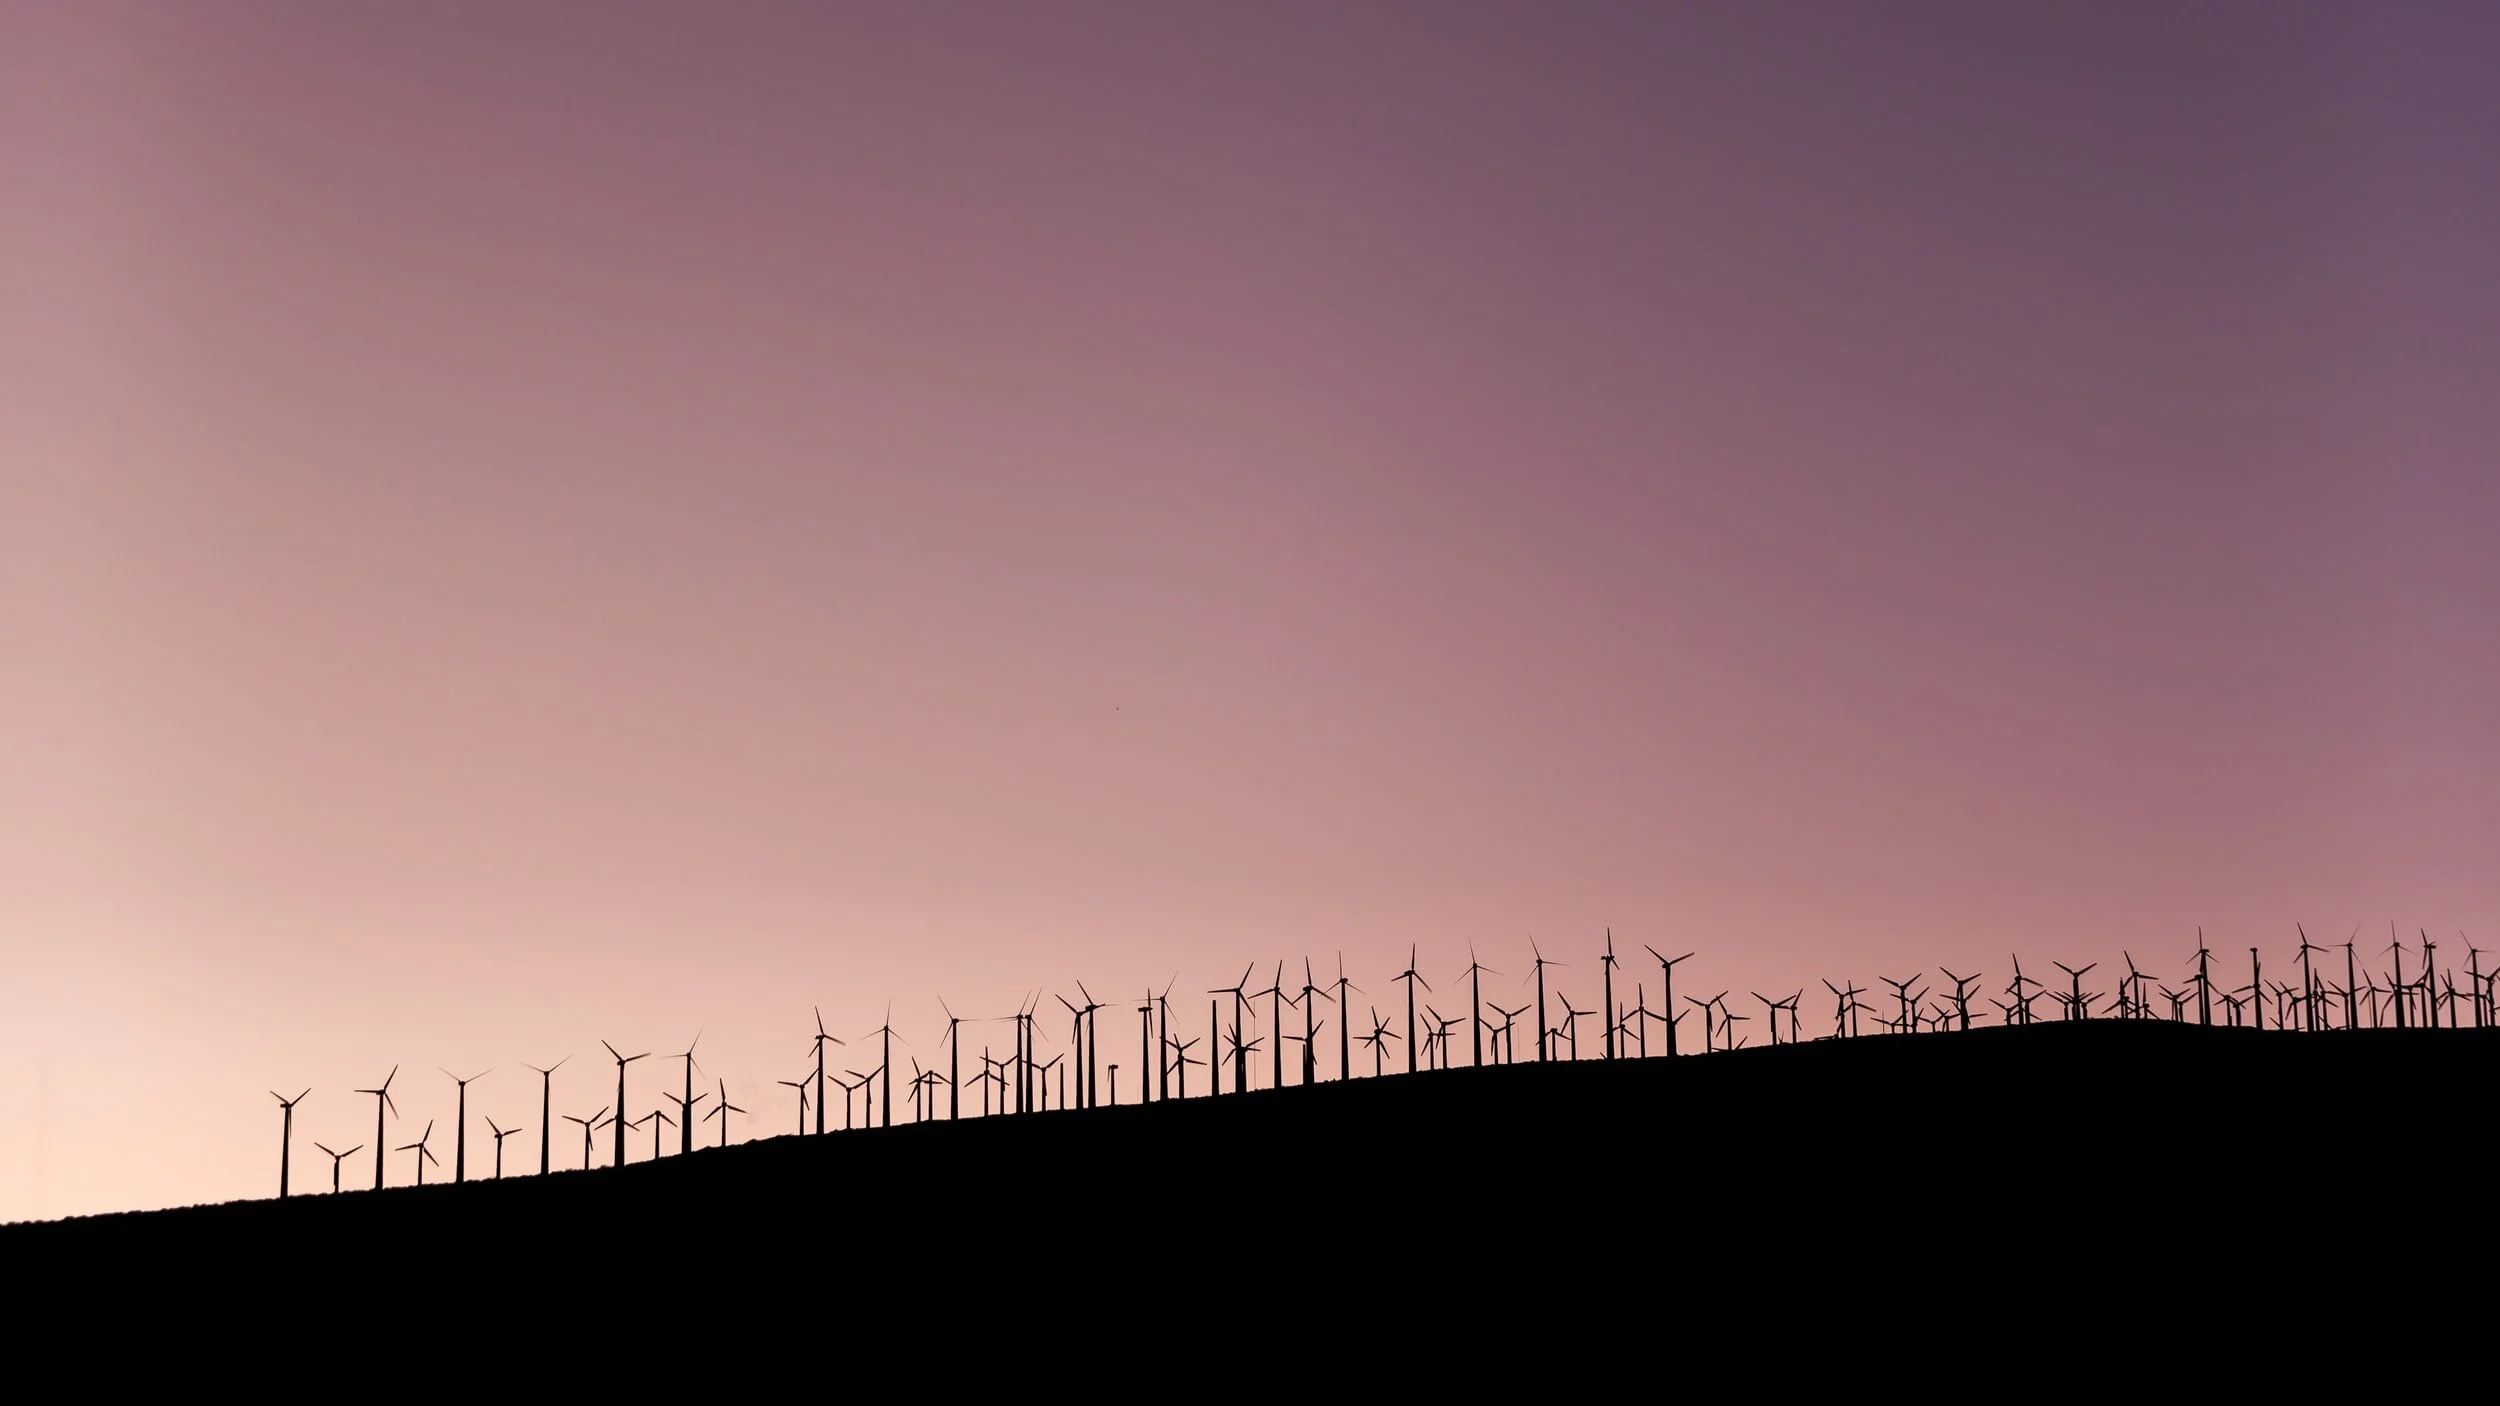
Flood defences against rising oceans and more extreme weather will cost developing countries ten times more as a % of GDP than rich counties (Unsplash by Tuan Nguyen)
Hurricane Katrina in 2005 may have been the costliest climate related disaster on record at $125 billion but thankfully the death toll was limited to 1,700 people. Compare this to Cyclone Nargis in Myanmar in 2008, where at least 140,000 people perished, yet the losses were just $4 billion.
Wealthy countries have the infrastructure, early warning systems and organisation required to deal with climate stresses. Poor countries don’t.

Annual average CO2 emissions per person (tonnes) in each country versus the estimated GDP impact of that country from 3⁰C warming. CO2 per person per region from Janssens-Maenhout et al., GDP impact from Roberto Roson, Martina Sartori et al. and includes impacts from labour and agricultural productivity, health, tourism, energy demand and sea level rise.
Making the matter more unjust is that the wealth of developed countries has accumulated over generations, driven by the industrial revolution, and burning of fossil fuels.
The more carbon each region has burnt, the richer its citizens have become.
North America & Western Europe have 7% of the global population yet emit 25% of annual carbon emissions today and are collectively responsible for 43% of all human emissions over the last 200 years.
As Lord Stern put it, this is “double inequity, those who suffer most contributed least”.
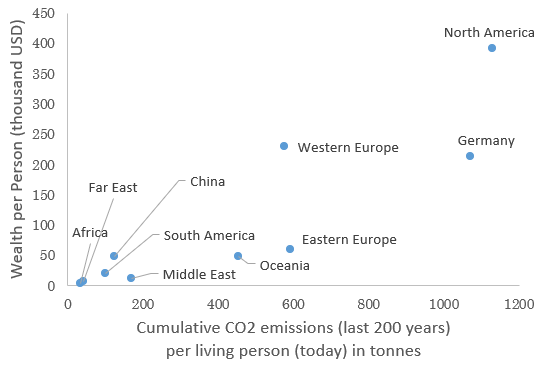
Cumulative CO2 emissions by region for the last 200 years divided by the current population versus the average wealth per person in the region (assets minus debt). Cumulative CO2 emissions from Tom Boden et al. CDIAC. Wealth per person from Credit Suisse Wealth Report.
The 10% of the global population living in the wealthiest countries of the world emit 30% of all greenhouse gas emissions, take home 50% of all global income, and have accumulated over 80% of the wealth in the world.
The 10% of the population living in the poorest countries of the world emit just 2% of all CO2, earn 1% of global income, and have no accumulated wealth – they live hand to mouth.
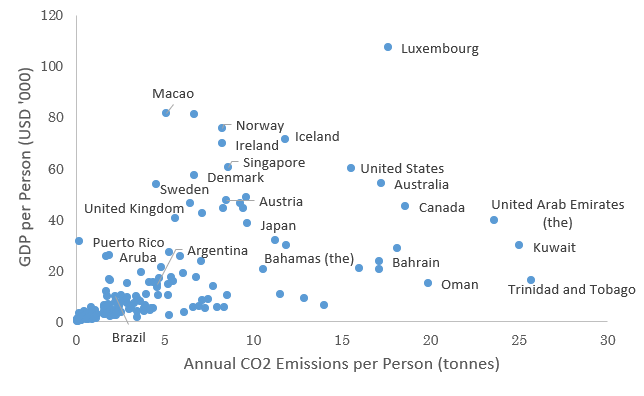
Annual CO2 emissions by region versus average GDP per person by region. Annual CO2 per person from Janssens-Maenhout et al., GDP per Person from World Bank.
Novelist Amitav Ghosh, writes, “Although different groups of people have contributed to it in vastly different measure, global warming is ultimately the product of the totality of human actions over time. Every human being who has ever lived has played a part in making us the dominant species on this planet, and in this sense every human being, past and present, has contributed to the present cycle of climate change”.
But how do we assign responsibility today, for human actions over all of time?
Climate Justice
Justice is about getting what you deserve. If rich countries got rich from emissions in the past, and stay rich with emissions in the present, then shouldn’t those countries bear a larger share of the cost for cleaning up the mess or pay compensation to the poorest countries worst hit by climate change?
This is the idea of climate justice. Who bears the cost of upfront investment to create a better system for all?
Here are the options:
Grandfathering: Use each nations’ emissions today as a benchmark and set percentage reduction targets in the future. This seems unfair given that it doesn’t account for the accumulated emissions of the past, the inequality of emissions today, and the wealth those emissions have created. Why should the US hold just 4% of the world’s population, 7% of dryland, and yet be allocated 15% of the atmosphere to dump CO2?
Egalitarianism: Take the remaining carbon budget and divide it up for each person on the planet whilst letting each individual trade their allocation if they have too much or too little based on their lifestyle. This would create a large transfer of wealth from rich to poor but doesn’t account for past emissions, ability to pay, ability to actually reduce emissions, or how to account for embedded emissions.
Polluter pays: We could count back to the start of the industrial revolution or maybe to 1990 when the world really grasped the potential damage of emitting greenhouse gases and share the clean-up cost based on past emissions. This seems fairer but what about those living in countries which emitted lots of CO2 in the past but their ancestors squandered the wealth and left no benefit to the inhabitants today?
Beneficiary pays: Maybe instead we share the costs based who derived the greatest wealth from emissions in the past. This accounts for historic emissions, inequality, and ability to pay. But what about countries like China which account for nearly one third of emissions today yet just 10% of emissions in the past: how do we get to net-zero if the largest polluters in the present aren’t pushing as hard as possible?
Net-Zero is Win-Win
The transition to a zero-carbon world is one that requires the cooperation and compliance of all global governments, corporates, and individuals. There is no global planner capable of serving up justice, only global mediation and our collective actions.
Global climate negotiations have often been viewed through the lens of the prisoner’s dilemma which suggests countries will act in their own self-interest. However, as the arbitration has continued to play out, the world is slowly realising that this isn’t a one-time game, it’s an iterative process, and that co-operation and collective action create the best possible outcome.
A rapid transition to net-zero will create a cheaper, more reliable energy system, with more jobs, less conflict, cleaner air, and will avoid worst-case climate damage.
Net-Zero is win-win for both nation-states and Planet Earth.