The Rate of Learning and the Cost of Net-Zero
In this post from the book net-zero:
Will cutting carbon dioxide end up way cheaper than expected? How integrated assessment models underestimate the power of the experience curve and overestimate the cost of reaching net zero.
How cheap will renewable energy be in the future? How wind, solar, and batteries will help deliver a cheaper energy system and why it’s the scale of production not the passing of time that matters.
We’ve already looked at the discount rate which I believe is one of the three most important numbers required to understand climate change. Now it’s time for the next…
The ‘rate of learning’ is our second dial of doom or boom.
The technological sensitivity which defines how quickly production costs decline as manufacturing is scaled up.
Dial it down and solving climate change becomes very expensive.
Dial it up and the transition to net-zero becomes very cheap.
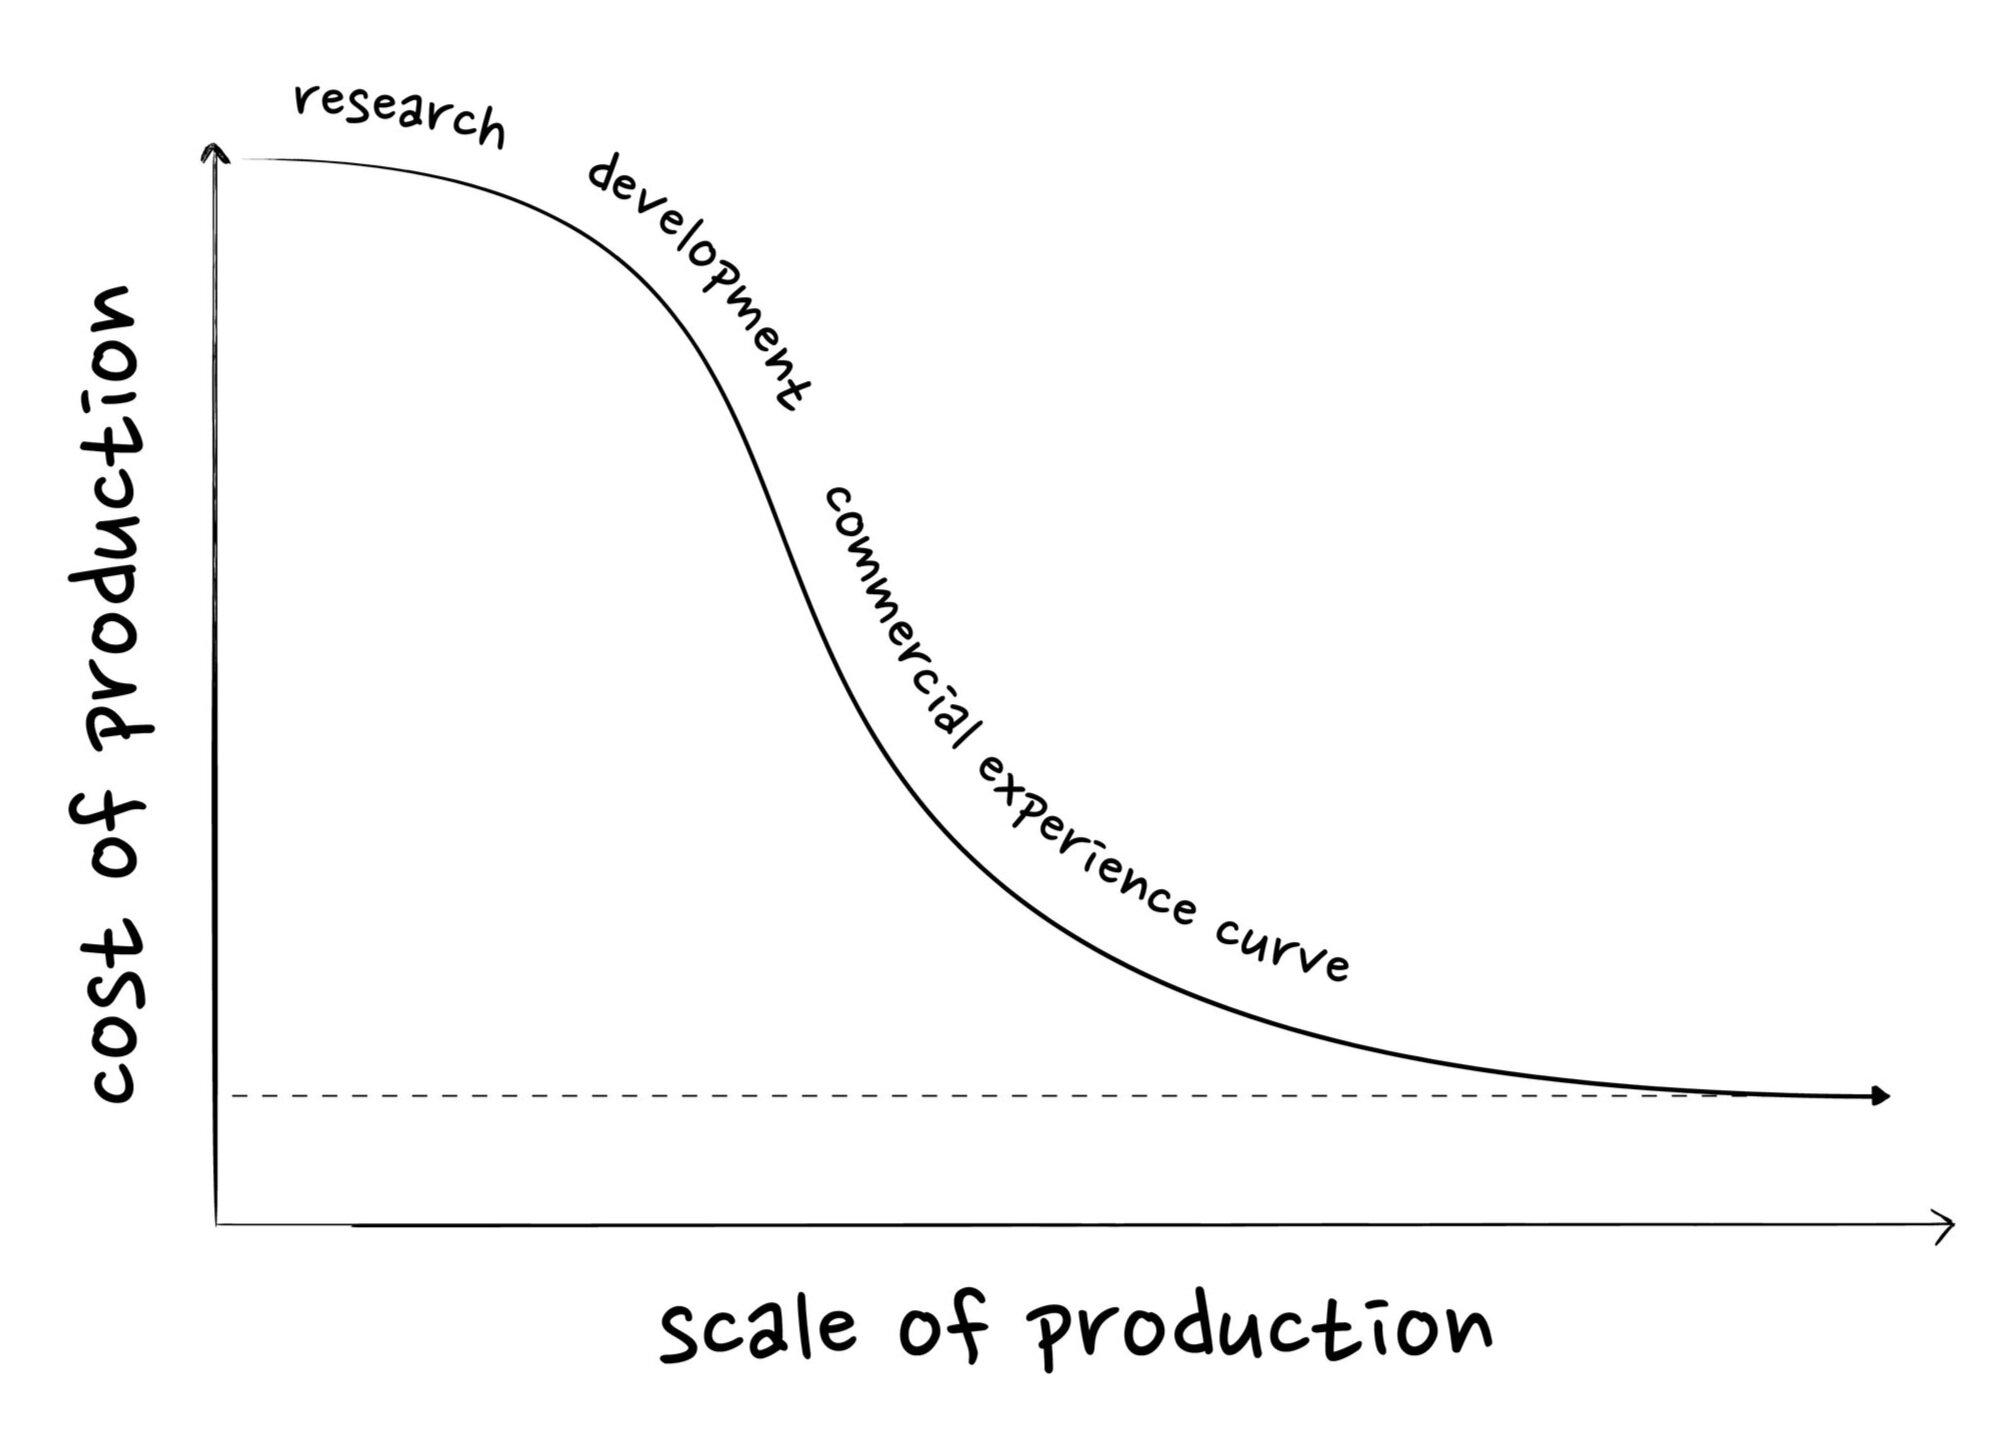
The Experience Curve
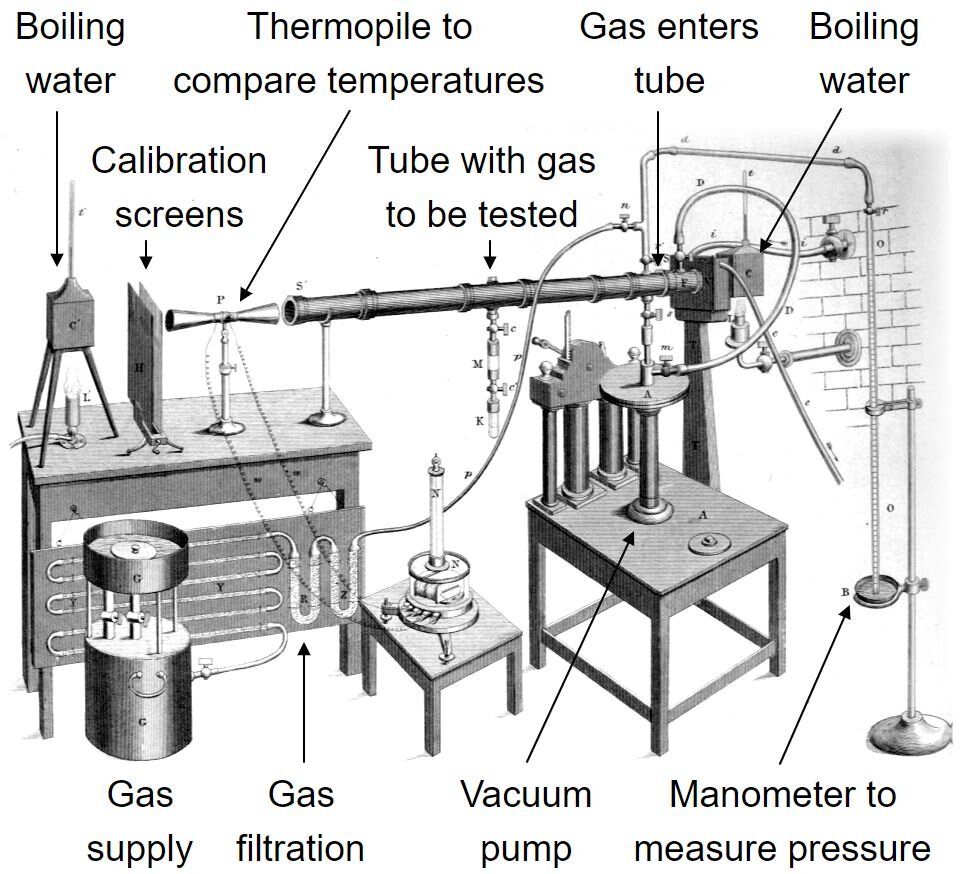
The term experience curve was coined by the management consultant BCG in 1966 while they were performing a cost analysis for a major semiconductor manufacturer. The theory held that every time the accumulated volume of computer chips doubled, the company’s unit production cost would decline by 20-30% because of the accumulated “experience” of manufacture.
As it turned out, not only did the experience curve work for the semiconductor industry, the concept could be applied nearly anywhere.
For most industries the cost of production declines as the scale of production increases, mostly thanks to improved manufacturing technologies, the division and specialisation of labour, and the lower allocation of overhead costs per unit production. A larger industry also attracts more competitors vying for a greater share of the market which pushes companies either to improve products or lower prices and recoup the difference through better production techniques or accepting lower profit margins.
The idea of an experience curve can be applied to most manufactured products but the rate at which the price drops will vary. Generally, cost of production will fall faster for highly standardised, repeatable, modular products. It will fall slower where there is a greater degree of variability, customisation, or batch processing in the design. The price will follow the cost of production unless supply & demand imbalances, consumer choice or marketing ploys intervene.
Prices decline exponentially, with the greatest falls up front then price reductions getting smaller and smaller as they trend towards a floor price. This represents the rock bottom cost of extracting and processing the materials with efficiencies near physical limits.
The idea that prices decline with accumulated experience and not just the passing of time is key to understanding and predicting the economics of a net-zero transition.
The Experience Curve
Solar PV
Since the year 2000, installed solar capacity has increased from 500 MW (equivalent to one coal power plant) to over 700,000 MW today (1,400 coal plants). Every time the installed capacity of solar has doubled, the installation cost has declined by 20%. Solar PV installation costs have dropped from $12 million to less than $1 million per MW over the last 20 years. The price of solar energy per kWh has fallen even faster with 30-40% reductions every time installations have doubled, because not only has the build cost come down but the financing has grown steadily cheaper.

Data from IRENA
The average cost of capital for a solar installation in Germany was 8% in the year 2000 – banks wanted a 6% return per year on their loans and partners wanted over 10% on their equity stake. Today, cost of capital has dropped to less than 2.5% (5% equity, 1-2% debt) because solar projects have proven low risk and reliable and interest rates have fallen across the world. This represents a best in class financing system with a competitive and well-regulated banking industry and certainty on revenue streams.
The average cost of capital across the world is closer to 7% (~5% excluding inflation) but continues to trend down as developers become more confident with the performance of the technology and financing structures evolve. Every 1% reduction in the cost of capital or discount rate reduces the cost of renewable power by 10-15%.
Solar PV electricity has already reached cost parity with coal or gas electricity generation (~$5c/kWh) in most areas of the world and yet solar electricity production still represents less than 1% of the world’s final energy consumption. This leaves plenty of room for further cost declines as installed capacity scales up. If solar PV were to grow to one third of final energy, installations need to double a further five times. Following the same (20%) experience curve implies costs drop towards $0.25 million per MW or less than $2c per kWh (global average) without violating the floor price of production.
Solar projects are already being bid at less than $2.5c per kWh for large solar farms in the Middle East where peak sun hours are very high, once solar is fully scaled these prices could be achieved all over the world.
Wind
Wind makes up just over 1% of final energy supply. The experience curve has delivered a 10% cost reduction for every doubling of capacity. Slower than solar, because the installations are less modular, but still rapid. If wind was to scale to one third of total final energy needs, cumulative capacity will double another four times over. Build costs could decline from $1-3 million to $0.7-2 million per MW and bring the total cost of wind electricity to between $2-4c per kWh (global average).

Data from IRENA
Lithium-ion Batteries
The onset of electric vehicles has driven down the cost of lithium ion batteries by over 90% in the last 20 years. The experience curve is running even faster than wind and solar with a 35% cost reduction every time installed capacity doubles (in cars or grid). If we assume lithium Ion batteries grow to serve one third of short term grid storage and the majority of passenger car needs, the produced capacity will need to double another 6-7 times over and the experience curve predicts costs reaching less than $50 per kWh. At this price point battery electric cars will become 15% cheaper than the gasoline equivalent (to buy and run), and the short term storage of electricity will cost just $2c per kWh.

Data from IRENA
Don’t Underestimate the Power of Learning
The huge price declines in wind, solar and batteries over the last ten years show why the power of the experience curve should not be underestimated. It also shows why the ‘rate of learning’ must be built into economic projections.
The International Panel on Climate Change itself notes that “most of the scenarios developed since the 1970s for energy and climate change make exogenous assumptions about the rate of technological change”. In other words the cost of net-zero technology like wind, solar, and batteries are input by hand each year rather than letting the model drive down costs as the technology scales (endogenous modelling).
The model ensemble from the IPCC AR5 report, published in 2014, had solar and offshore wind electricity at $11-12c per kWh (it is now less than half that price) and only some of the model pathways electrified transport and even then only did it in the second half of the century (presumably because lithium ion batteries were deemed prohibitively expensive).

A broken computer - Junk in Junk out (Unsplash by Tistio)
The costs included in many of these models are based on expert analysis or energy forecasting bodies which have always underestimated the rate of progress in renewables. Historically price reductions and the ‘rate of learning’ in the energy sector have been slow: extracting fossil fuels relies on geology, projects are one-off, bespoke, and expensive with high risk, plus the more fuel you extract, the harder it becomes to extract more. But renewables technologies like solar, wind, or batteries are modular, and the ‘rate of learning’ is fast.. Understand these differences and you understand why net-zero gets so cheap so quickly.
Forecasting agencies and analysts continue to use outdated cost estimates, underestimate the rate of learning, and understate the potential capacity additions of renewables. This means economists and governments using these forecasts continue to overestimate the cost of reaching net zero and delay decisive action. As Al Gore puts it, “The Sustainability revolution… combines the scale of the industrial revolution with the speed of the digital revolution”.
We need to break down the engrained idea that fossil fuels are cheap and zero carbon is expensive – this is not the case. Net-Zero will prove cheaper, safer, and more reliable. A rapid transition will give the best possible economic and employment outcome before even considering the socio-economic benefits from reducing air pollution and avoiding climate damage.